Solar data and PV engineering protocols, accessible through UI and API
LuData gives access to historical, typical-year and forecast meteorological data, terrain and horizon services, automated loss assessments and PV yield simulation. Use the UI to manage scenarios, monitor usage and explore outputs, or use the API to integrate these services into your own engineering processes.
What LuData gives you
LuData combines scenario management and usage monitoring in the web interface with structured access to historical, TMY and forecast data services, terrain and horizon extraction, loss assessments and PV yield simulation.
API access and documentation
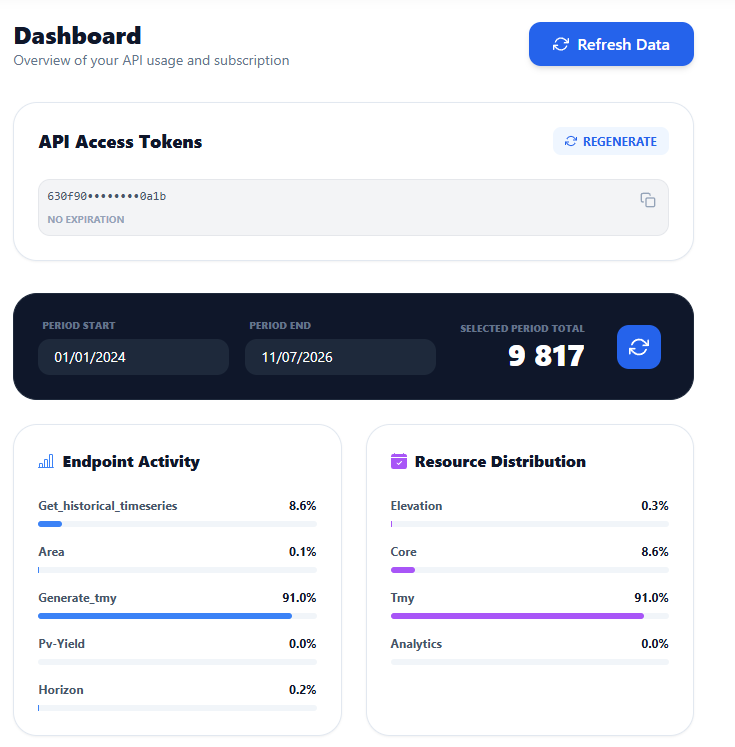
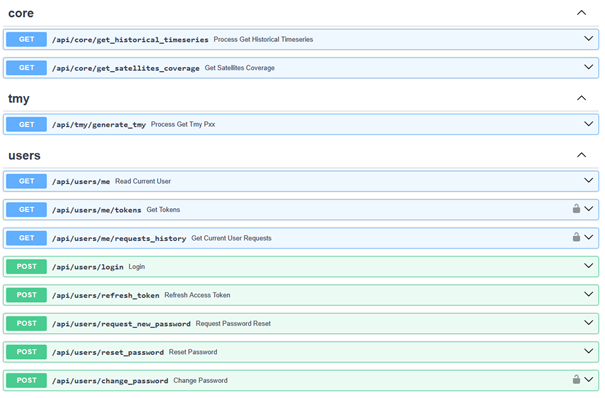
Create and regenerate API tokens, then browse scope-filtered endpoint documentation through Scalar or Swagger from your LuData account.
Scenario management
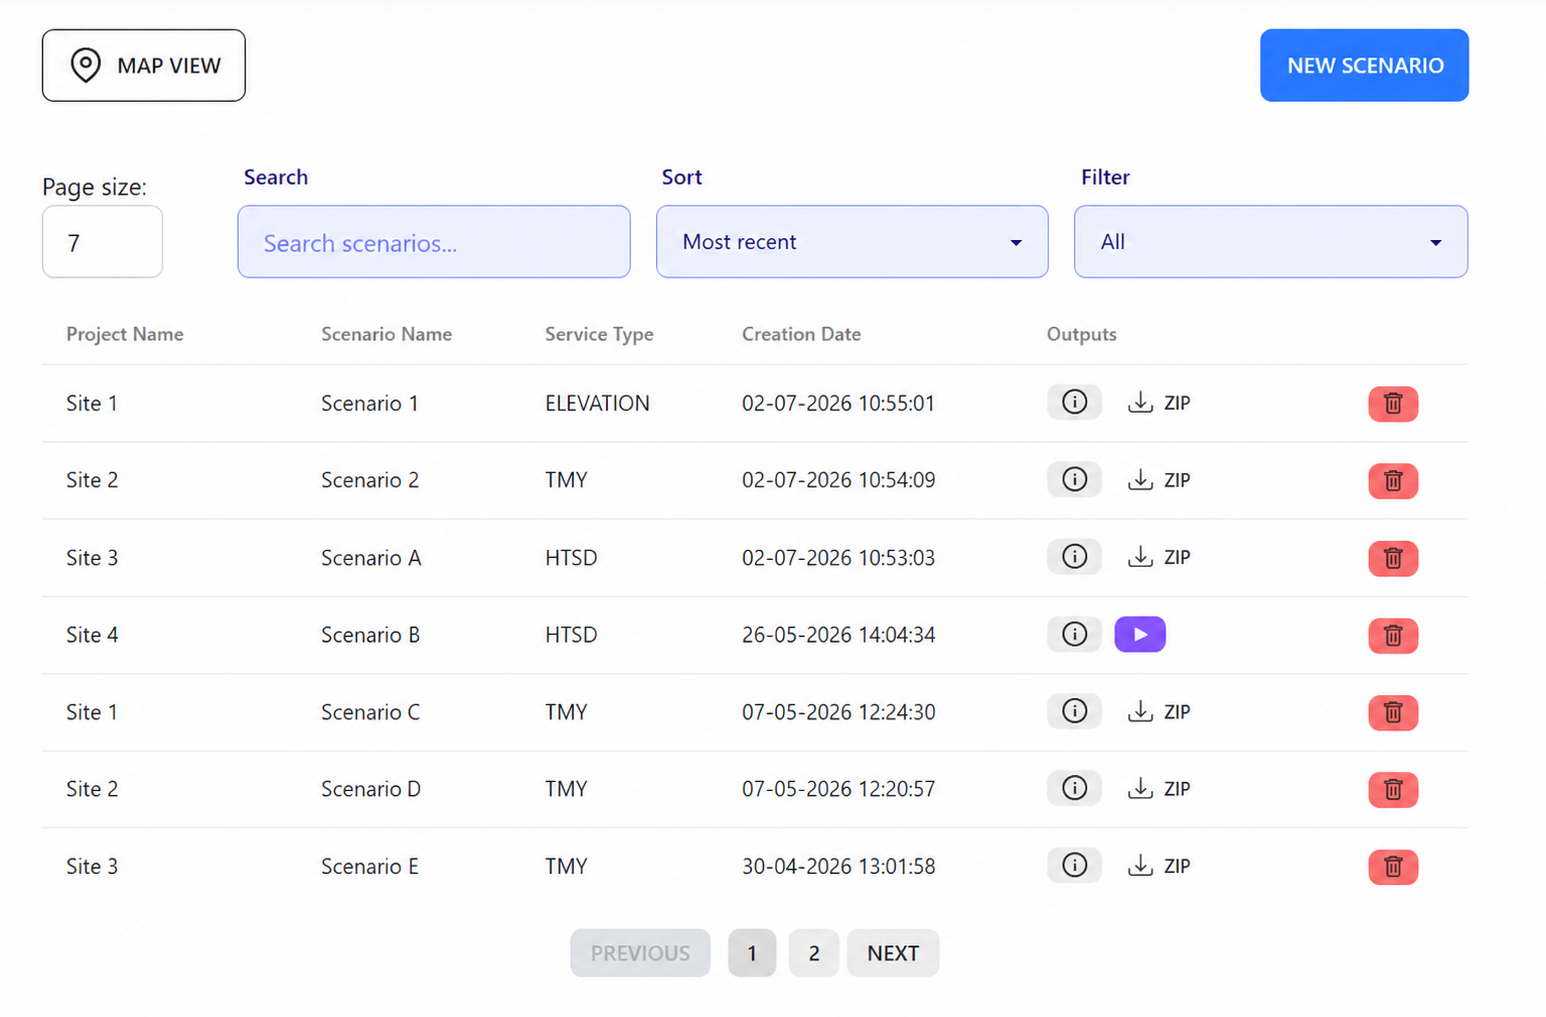
Configure, run and download historical time series, TMY and elevation scenarios (forecast is API-only). Track project name, scenario name, service type, creation date and ZIP outputs when processing is complete.
List and map views
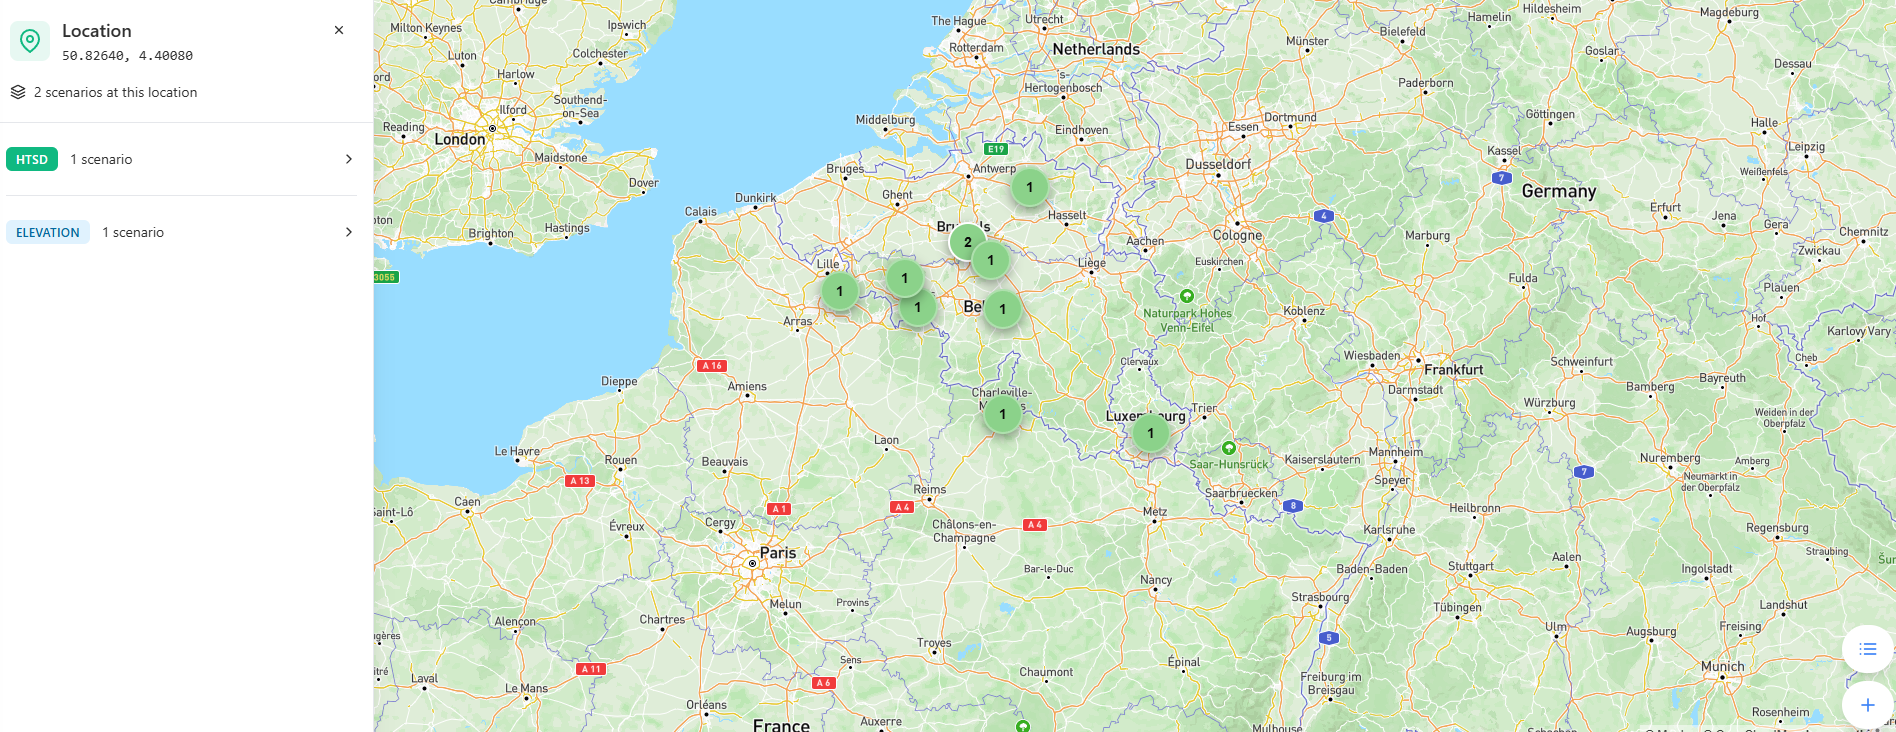
Review scenarios in a searchable list or locate them geographically through an interactive map interface.
Usage monitoring
Monitor used requests, remaining allowance, endpoint activity and usage history from the account dashboard.
Available services and protocols
Historical, typical-year and forecast data services, terrain and horizon extraction, environmental loss assessments, and PV system modelling through yield simulation. Each item shows whether it is available through the UI, the API, or both.
Data services
- Historical time seriesUI and API
- TMY / PXX datasetsUI and API
- Forecasting from day-ahead to 10 daysAPI
- Point elevationUI and API
- Terrain gridUI and API
- Horizon profileUI and API
Environmental losses assessment
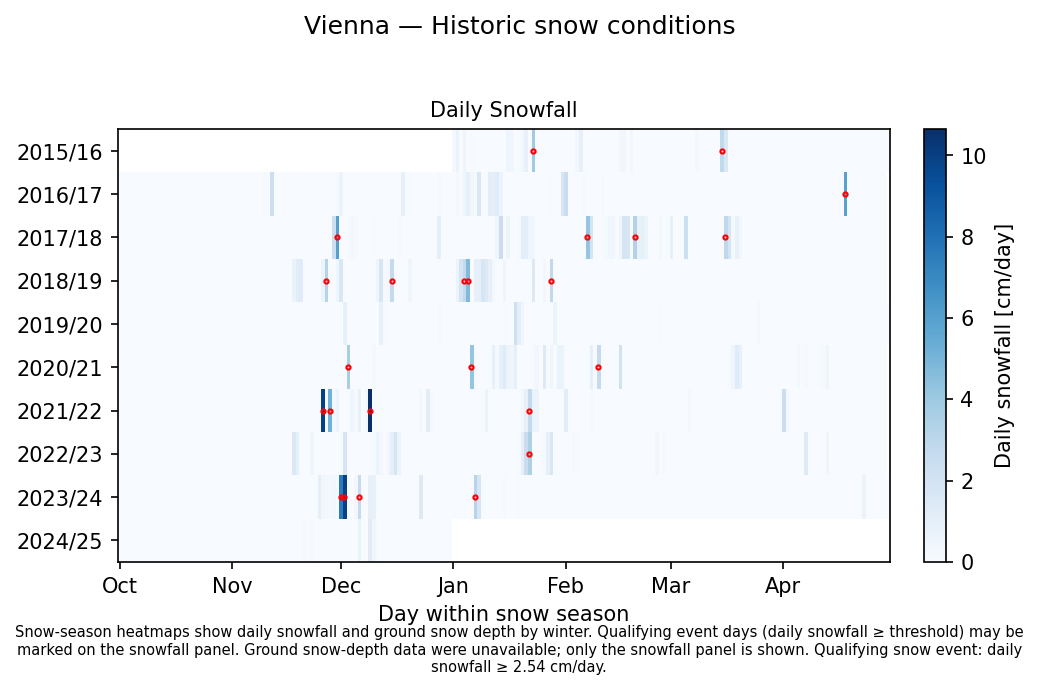
Standalone snow and soiling protocols for deeper site-specific analytics. Detailed assessments run through the API; simpler P50 estimates are also available as helpers inside the Yield simulation UI.
- Snow AssessmentMonthly and historic snow-loss diagnostics for standalone analysis or yield workflowsUI and API
- Soiling AssessmentPM and soiling-loss profiles for standalone analysis or yield workflowsUI and API
PV system modelling & yield simulation
End-to-end PV system models and loss calculations covering layout, inverters, shading, wiring, temperature and spectral effects, environmental losses, and performance reporting.
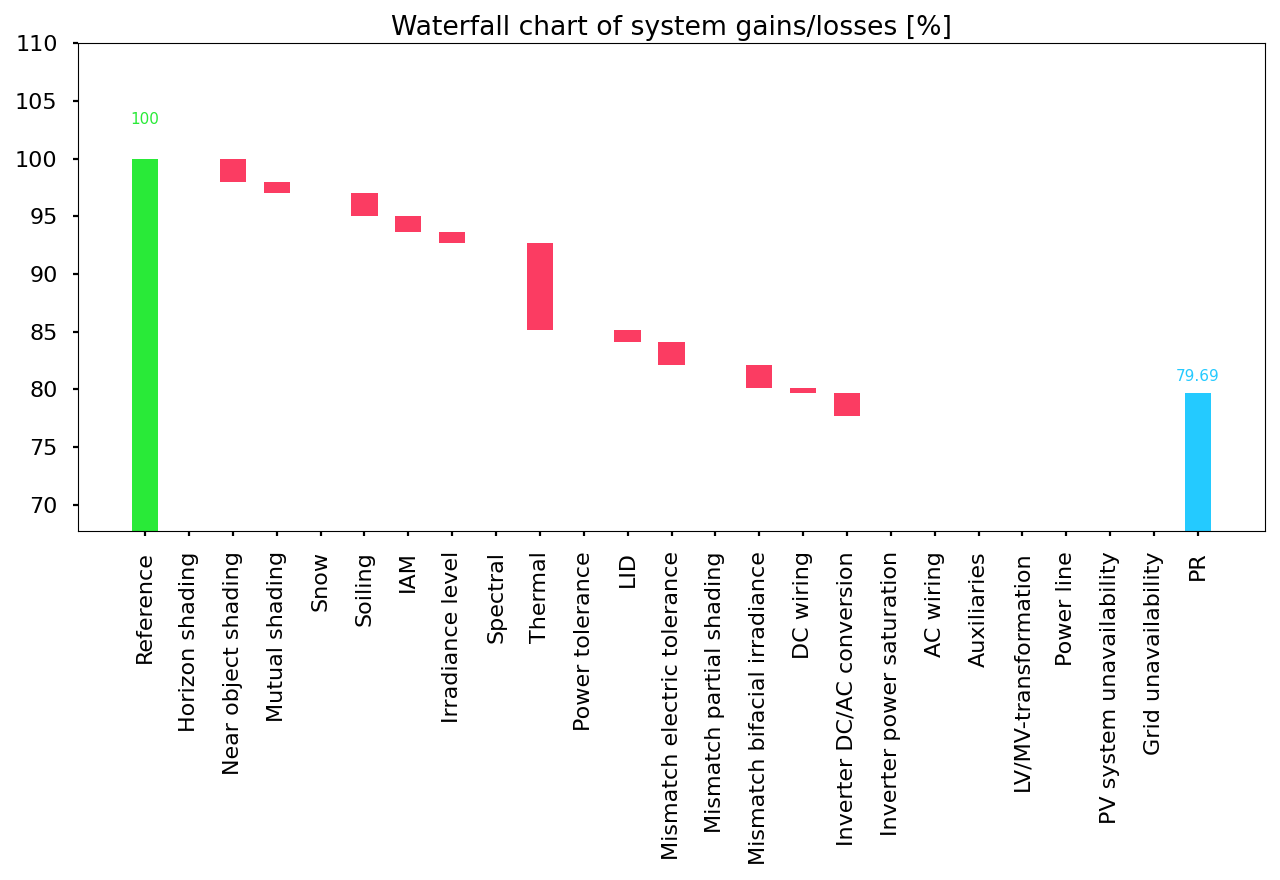
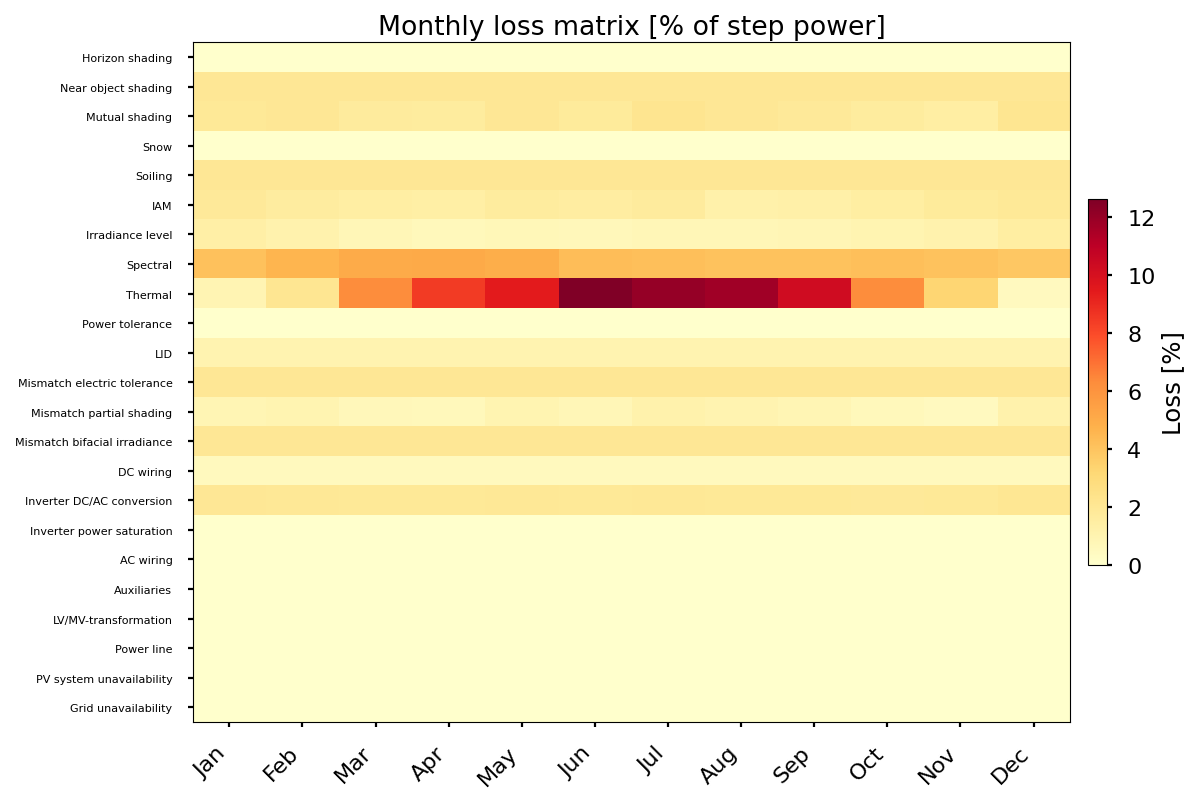
- PV yield simulationHourly, monthly and yearly yield outputs, waterfall charts and loss matricesUI and API
Comparison with other PV simulators. So far benchmarked against PVsyst on three utility-scale configurations, with annual energy within 1.8% of the reference (model-to-model comparison). Read the full PV yield benchmark.
Environmental loss assessments and PV yield simulation are available when enabled for your account. Detailed snow and soiling API runs are metered; simpler helpers inside the Yield simulation UI are included. See pricing
Global dataset coverage
Satellite-derived irradiance, ERA5 reanalysis and Copernicus DEM coverage supporting LuData data services.
- Satellite-Derived Irradiance
- Reanalysis Data (ERA5)
- Digital Elevation Model (DEM)
Historical solar irradiance from GOES-EAST, Meteosat-Prime and Meteosat-IODC.
Validated Against a Global Standard
Our data is rigorously benchmarked against available and well-maintained ground measurement networks to ensure reliable and validated results. Read our most recent internal validation report to learn more. Explore our global validation sites below.
Built for API-first automation
Use LuData to avoid rebuilding the same datasets, assumptions and loss calculations for every project. Call the protocols directly, integrate them into your tools, and standardise repeatable PV engineering workflows.
- Historical time series, TMY, elevation and forecast endpoints are available through LuData. Datasets and terrain run through UI scenarios and direct API calls; forecasting is API-only, returning ZIP or JSON outputs.
- PV yield simulation is available through the UI and API. Detailed snow and soiling assessments are available through the API; simpler snow/soiling helpers are included inside the Yield simulation UI.
- Scoped Scalar and Swagger documentation are available after sign-in for entitled users. See also the yield simulation documentation.
Examples of outputs
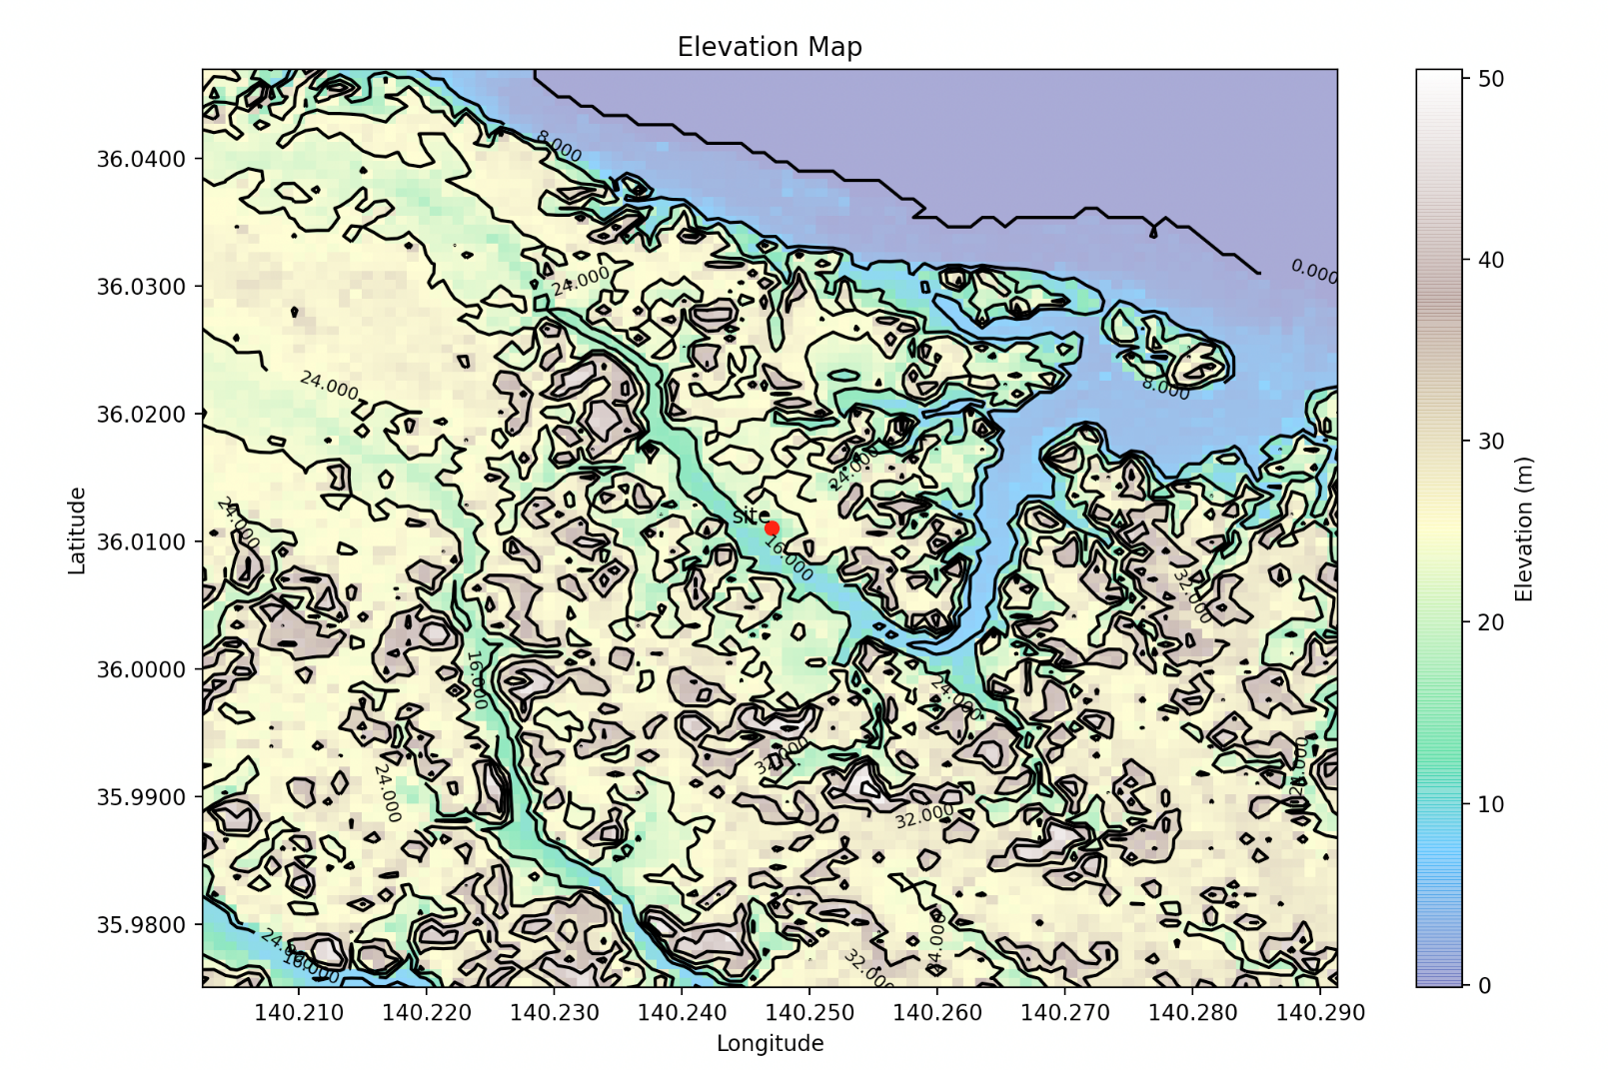
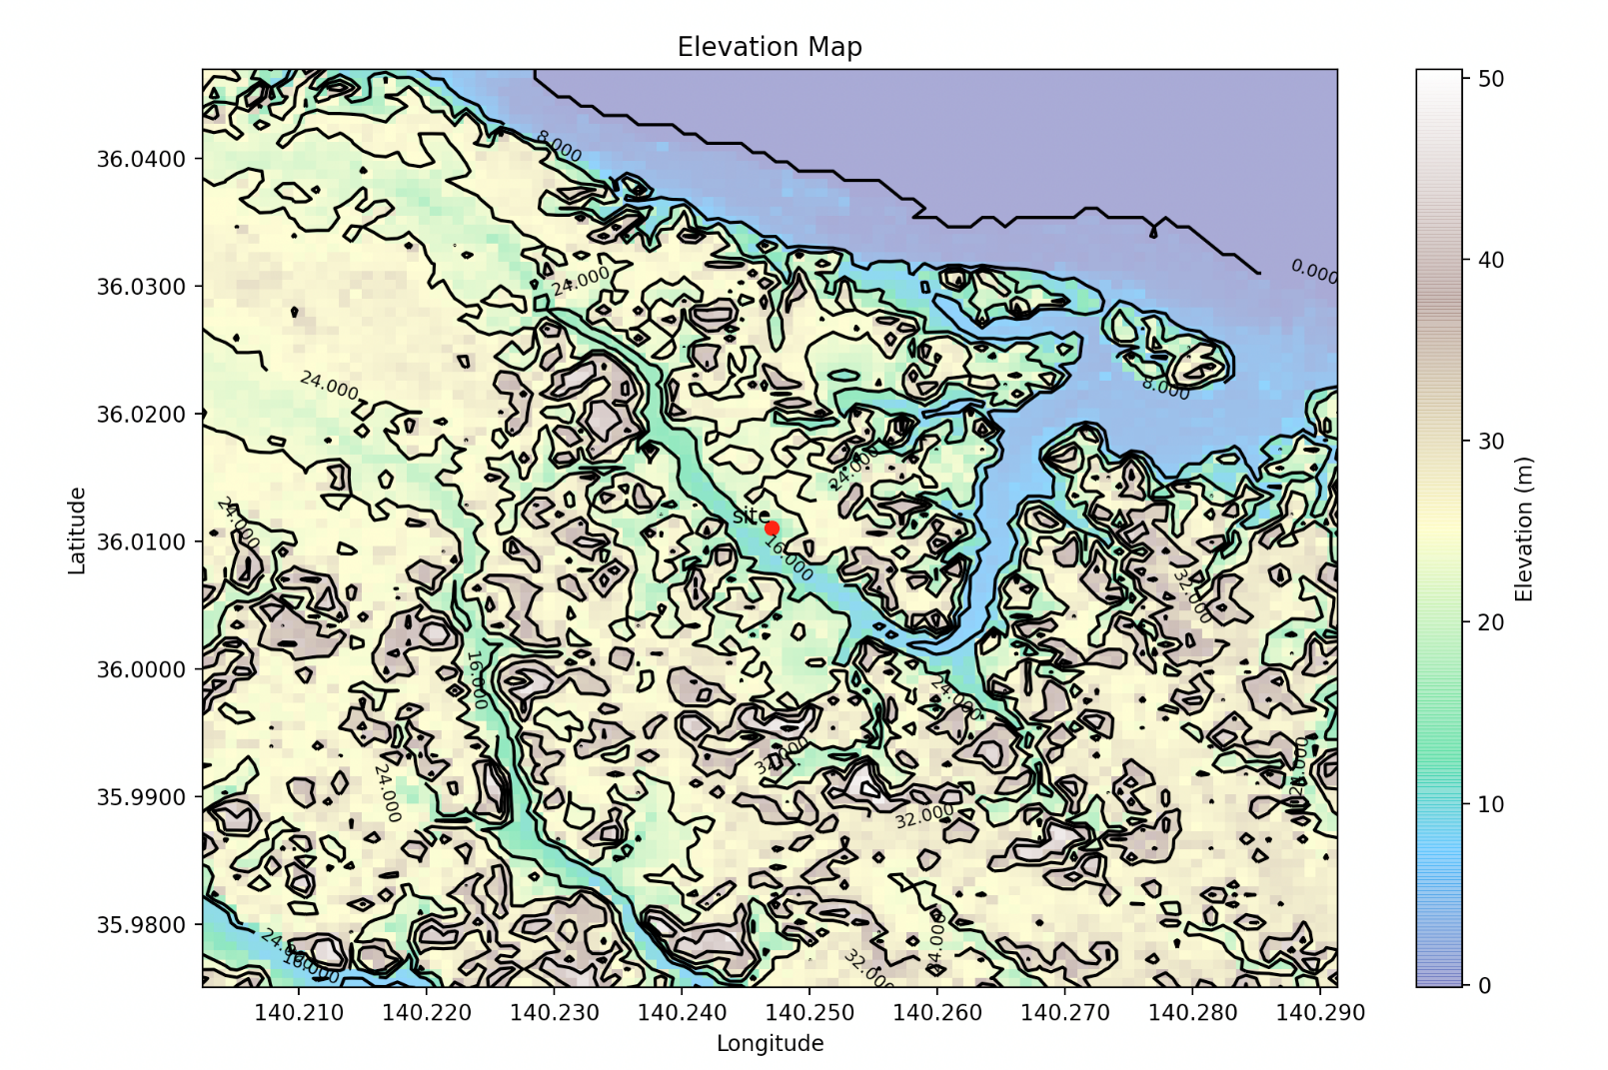
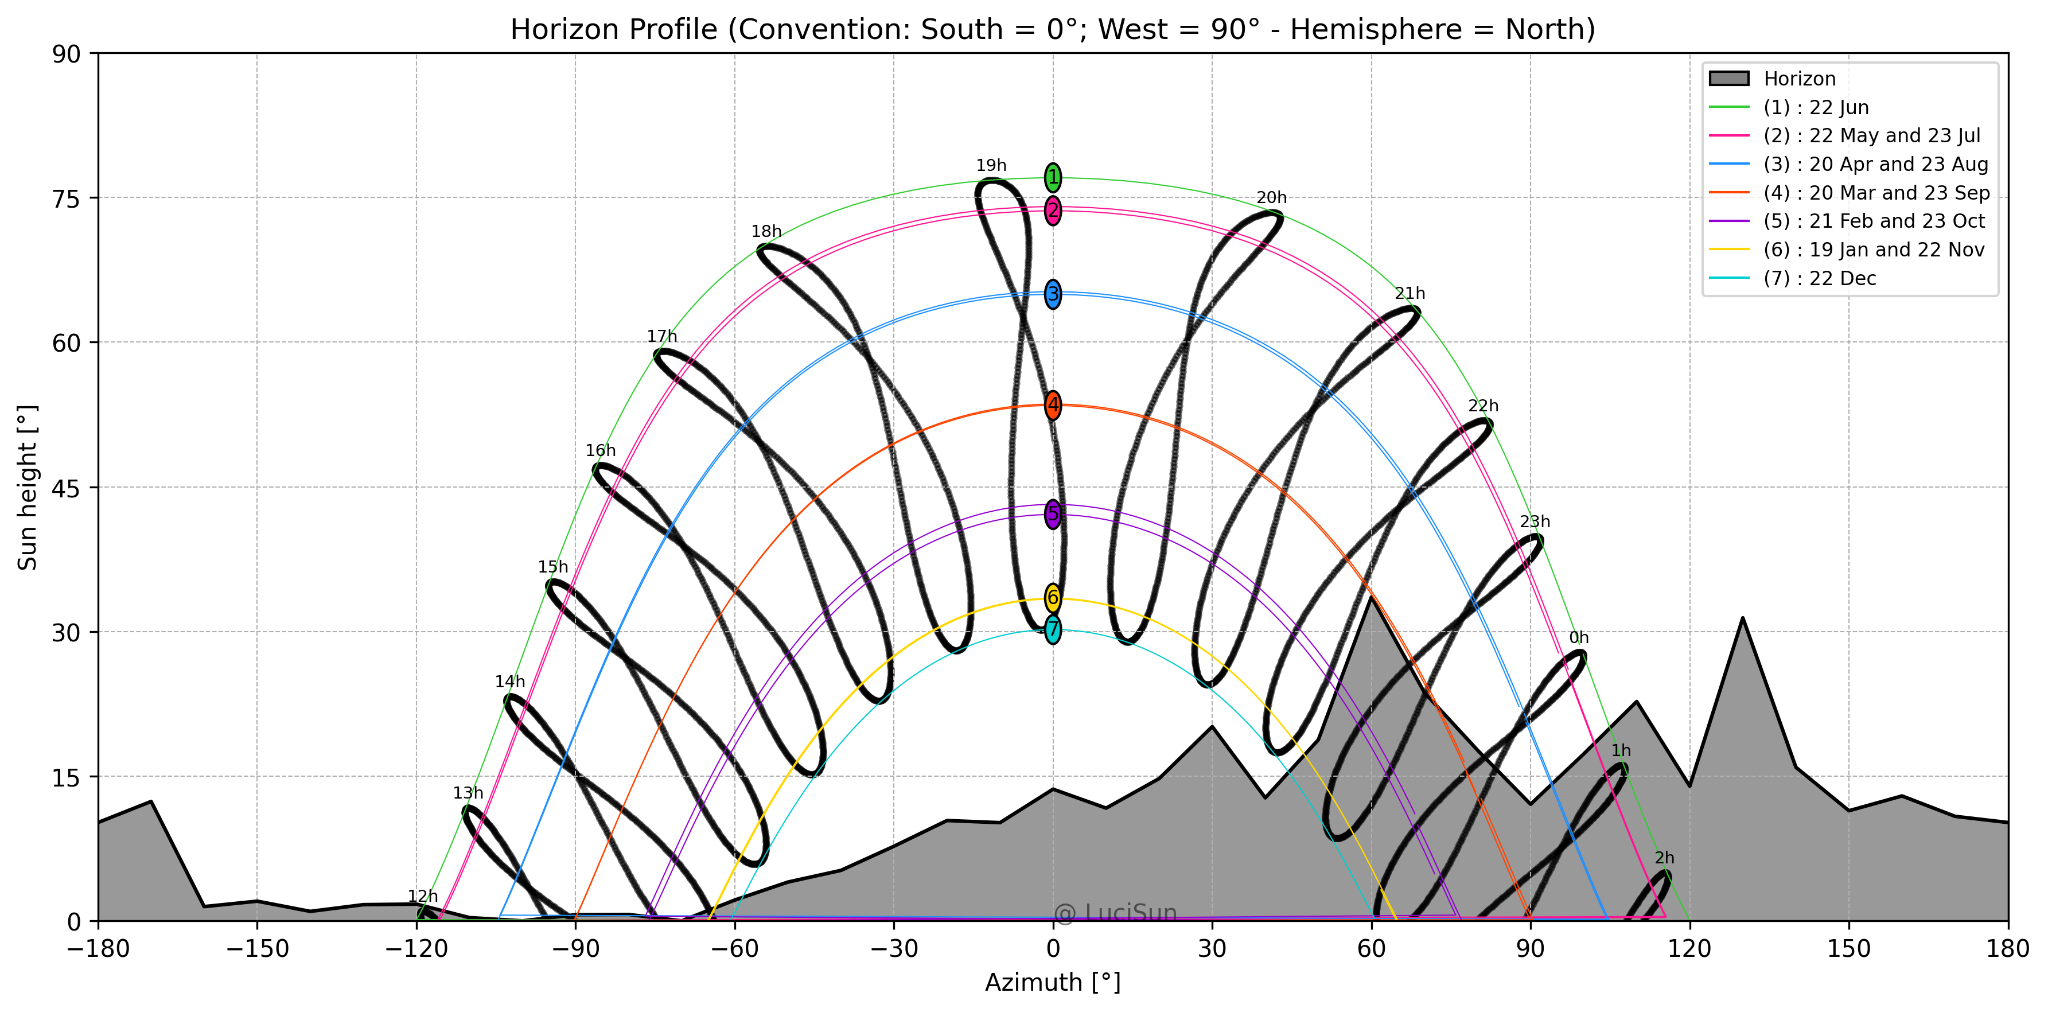
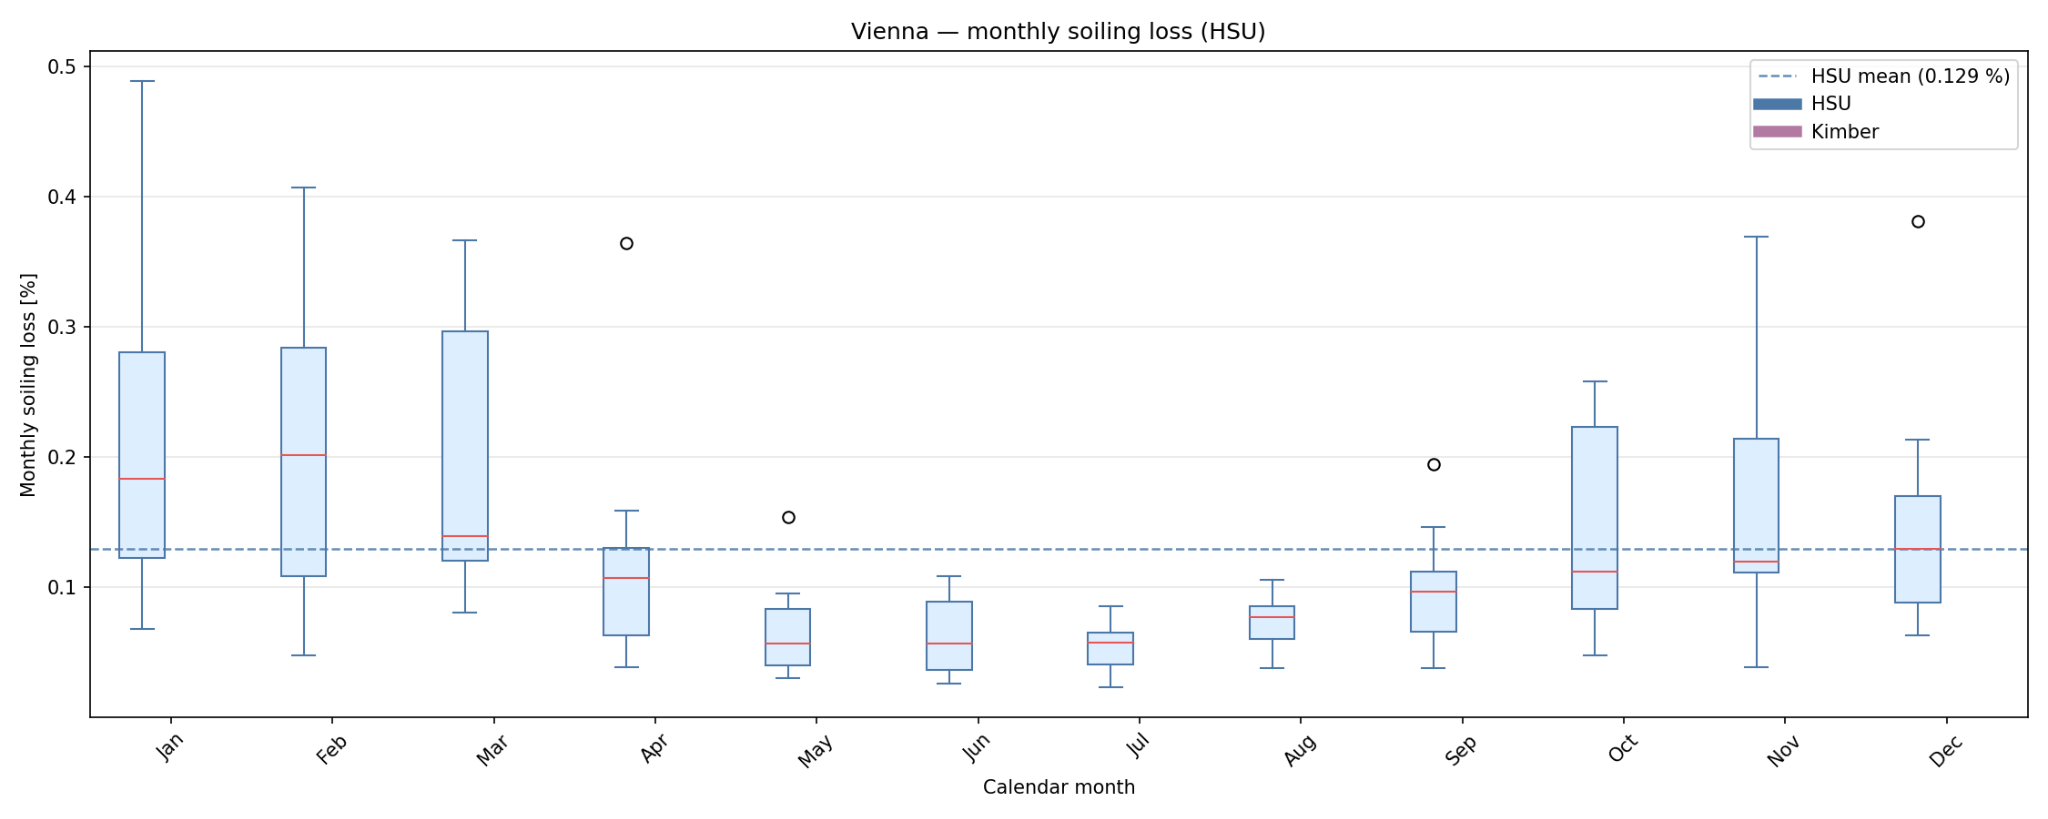
Selected outputs from elevation, loss assessment and PV yield services. Terrain and yield illustrations come from service outputs. Snow and soiling figures are illustrative examples of assessment results returned as JSON.
Who it is for
LuData is built for teams that need reusable solar engineering calculations without manually rebuilding datasets, assumptions and protocols for every project.
Open to specialised protocol partners
LuData can also support selected partners who want to expose specialised endpoints through a managed API layer. Since the infrastructure for authentication, API access, documentation, usage tracking and scenario management is already in place, LuciSun can help wrap, manage and distribute complementary datasets, models or protocols through LuData.
Expanding the protocol library
LuData will progressively include additional LuciSun PV engineering protocols through the same web interface and API environment.
Get started with LuData
Launch and Starter can be purchased on the pricing page. Request a free trial to evaluate LuData, or contact sales for Growth, Pro and Platform options.